BACKGROUND
Kroger serves over 11 million customers daily with many opting to use their grocery pickup service. As a user research intern at Kroger Technology & Digital (KTD), I was tasked with improving the quarterly survey that goes out to Pickup associates who work behind the scenes to fulfill online orders. Over the course of the summer, I collaborated with researchers, product designers, and stakeholders to gain better insights into the experiences of Pickup associates.
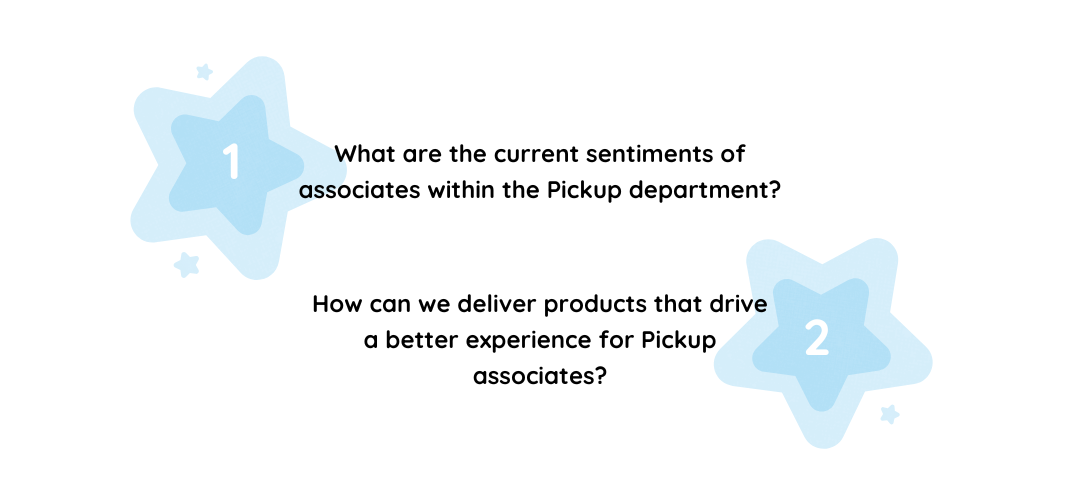
There were two main questions we seeked to answer through the survey:
TIMELINE
METHODOLOGY

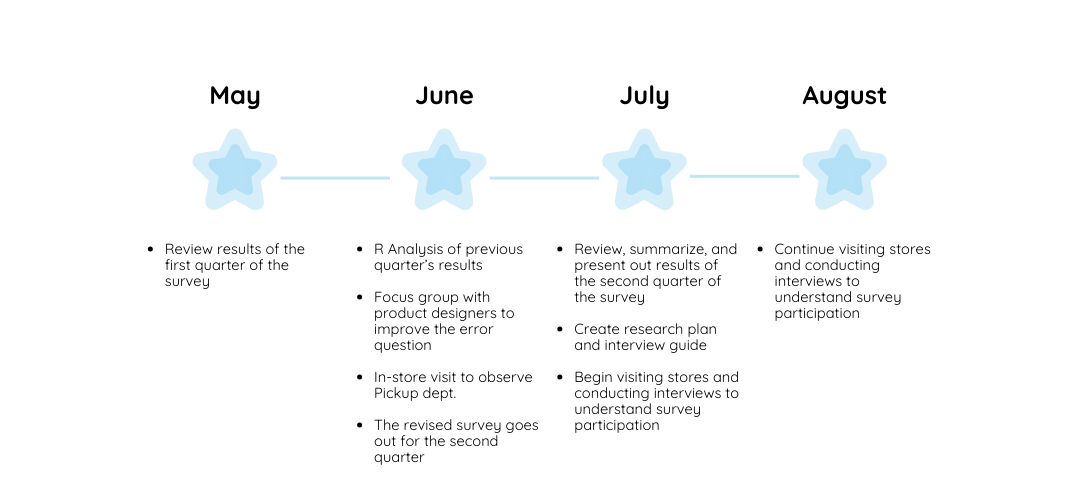
At the time of my internship, the previous quarter had recently concluded, so part of my project was to analyze these results to inform the future of the survey. Drawing upon my data analytics background, I chose to build regression models in R to explore the relationships between different quantitative factors, such as role, generation, time at the company, and various measures of sentiment (in regards to technology, labor, and the Pickup department in general). I created several models to investigate different relationships and dig into the main drivers for associates’ sentiment.
One survey question I specifically focused on was related to errors that associates experience while using technology within the Pickup space; the goal was to produce actionable and useful feedback for product designers. To better understand what they needed from this question, we decided to conduct a focus group with the product designers who would be acting upon the survey results. Some questions we asked included how they define an error, what feedback would be helpful (or unhelpful) to receive, and which format they would prefer for the question–depending on their priorities, this could be aimed towards discovering new errors or quantifying the frequency of known errors. I moderated the discussion and used a Mural board to organize everyone’s thoughts.


The deepest insights came from going in-store to observe and talk to those who would be most impacted by the results of the survey–the Pickup associates themselves. The purpose of these visits was two-fold: 1) to observe the way Pickup associates work and how they use technology, and 2) to understand current awareness of the survey. We noticed that participation in the survey had gone down considerably between quarters and wanted to figure out what could be driving this–were people aware of the survey, but choosing not to take it due to time constraints? Were people completely unaware of the survey, or overwhelmed by the number of surveys they had received over the past weeks? I wrote a research plan and interview guide to address these questions, and we visited multiple locations–some smaller and some larger, some with newer technology and some with more outdated technology. Since these were interviews with associates, we could not provide incentives to participants, but everyone we talked to was eager to share their experiences with us.
INTERVIEW RESEARCH QUESTIONS
- What drove associates’ decisions to take/not take the pickup survey in both quarters?
- How aware are associates of the survey?
- What is the current perception of the survey?
- What might help improve participation rates for future quarters?
- What do associates expect KTD to do with their feedback?
SAMPLE INTERVIEW QUESTIONS
- What are your thoughts on the amount of surveys that have been presented to you by Kroger over the past few months?
- What are some ways that you have shared feedback about your pickup experiences within the past 6 months?
- How would you describe your past experiences with the quarterly pickup survey?
- How confident are you that action will be taken based on this survey?
ANALYSIS AND SYNTHESIS
Given the large amounts of data–both quantitative and qualitative–resulting from the survey in both quarters, it was important that we organized it to draw meaningful insights. This was a collaborative process and often involved sharing our thoughts and observations using Mural. For example, in addition to analyzing the quantitative results of the previous quarter in R, I created a board mapping out the types of errors that were encountered for different applications and the reasons why they occurred; from here, we were able to identify common errors to discuss with the product designers. After conducting in-store interviews, we debriefed and sorted observations into overarching themes using sticky notes and an affinity map. This greatly helped us to develop and summarize our insights when it came time to present our findings.
RESULTS
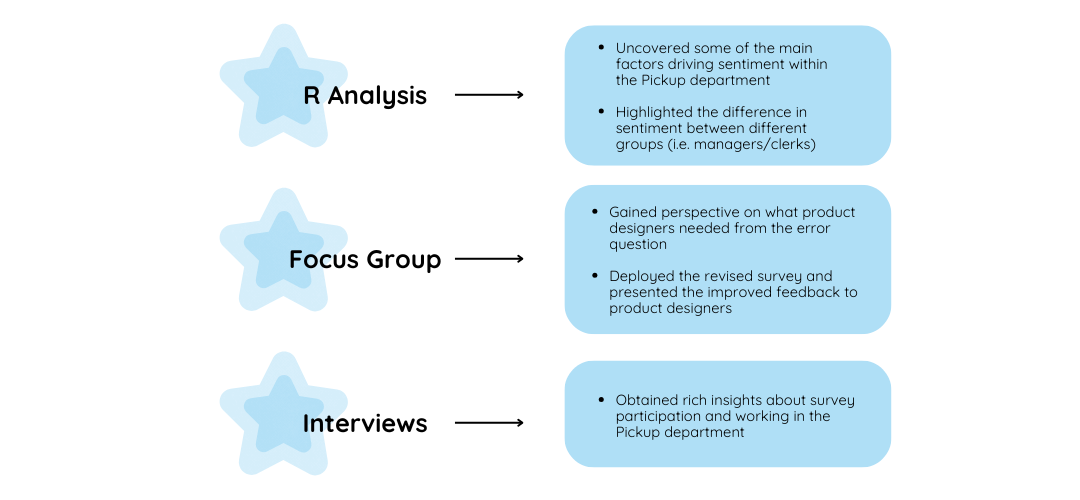
Ultimately, each of the different methods of research provided useful findings to inform the future of the Pickup survey. After uncovering interesting insights into some key drivers of sentiment within the Pickup department, I documented the statistical analysis in a report and summarized these to present to stakeholders. These quantitative results added credibility to our findings, provided a view into the current sentiment within the department, and allowed the research team to better advocate for Pickup associates.
Conducting the focus group was key to revising the error question of the survey. Before this, there was a wide range of answers to this question; many participants did not understand what the purpose of the question was or gave vague answers that were not actionable. After hearing from product designers, we gained perspective into what feedback would actually be useful for product designers to receive:
- Designers need to understand what the associate was doing in the app when the error occurred, not just the error itself.
- It is helpful for designers to know the frequency of errors in order to prioritize accordingly.
Thus, we changed the format of the question from an open-ended question to a multi-select question with commonly known errors to quantify their frequency; we also provided an ‘other’ option to identify new errors. Then, we asked associates to describe what they were doing when the error happened. We shared the results from the revised survey with the product designers from our original focus group, who unanimously agreed that the results were an improvement over the original survey.
Finally, while the survey captured a large number of responses and helped us keep a pulse on the current state of the department, talking face-to-face with Pickup associates in interviews provided the deepest insights into their everyday experiences. Though we learned about the current awareness of the survey and some reasons that associates may have participated or not participated in it, we also learned about some of the pain points Pickup associates face when doing their jobs. By documenting these interviews and witnessing the emotion behind them, we could give a voice to the real experiences of these associates, ultimately pushing for positive change within the department.
REFLECTION
I am very grateful for the opportunity to complete my first user research internship with Kroger Technology & Digital. Over the course of the summer, I grew as a researcher, data analyst, and a team member; the most rewarding aspects of my experience were getting to work with the User Research team and doing meaningful work that will impact the experience of Pickup associates.